This post is focuses on a project where I scaped comments from CBC News website articles. (BTW, there are lots of “CBC’s” in the world. The one I am referring to is the Canadian Broadcasting Corporation.)
There is another post that focuses on analysis and visualization of the scraped data.
As a Canadian often travelling and working abroad I use the CBC News site as a way to stay current on Canadian news.
However, as a data worker I was curious to analyze them. I wanted to learn more about who made how many comments, frequently used words and phrases, and interactions between people commenting (comments and their replies) on the site.
The technique used to scrape the articles and their comments was to show all available comments on the page and save and download the entire html page locally.
Then Python was used to extract the article details and the comments and replies from the downloaded document into a csv file. The csv file could then be analysed using Python.
Let’s continue with a bit more detail on the technique used.
The comments section is found below the news article (though comments are not enabled for all articles!) The screenshot below shows the comments section.
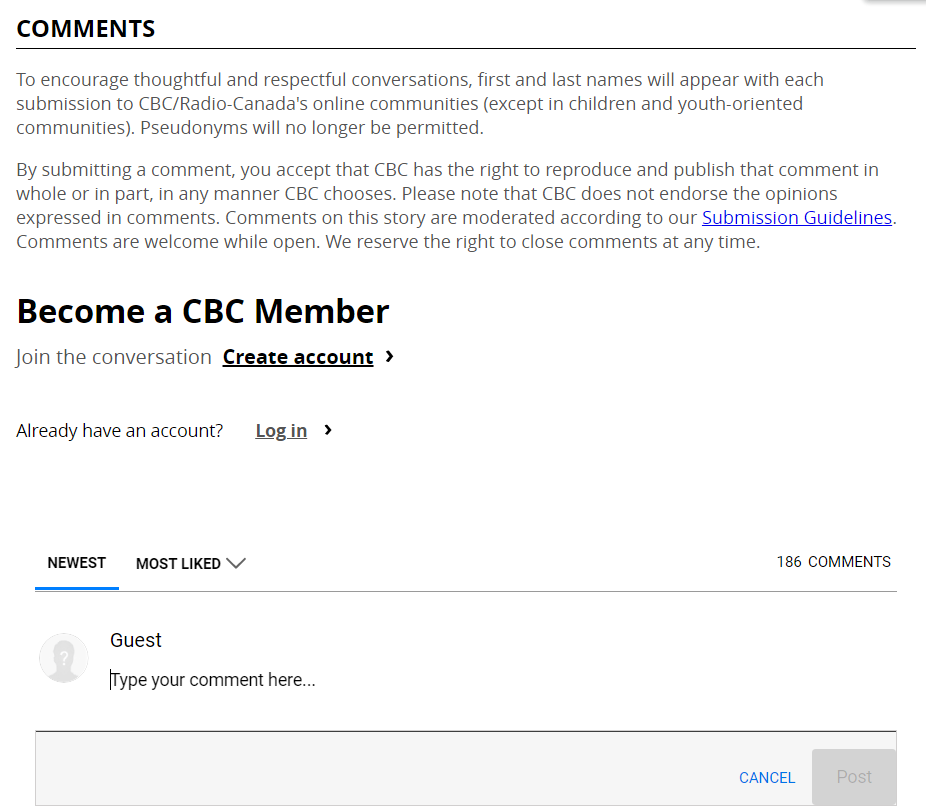
After an article is posted comments are made dynamically and the list of comments grows longer and pagination is used that requires manual clicking of a “load more” button to see new comments.
After a while commenting is disabled. So each article can have varying numbers of comments. As previously mentioned, many articles never have commenting enabled. Some articles can have more than 10,000 comments by 1,000’s of people.
The comment delivery method makes it very difficult to read all of the comments because it uses the “endless scrolling” format.
In fact, for articles with more than a couple of hundred comments, it is likely no one will read all comments and their replies because the endless clicking is so tedious.
Pagination requires clicking a “SHOW MORE” button at the bottom of the comments again and again to show more comments.
![]()
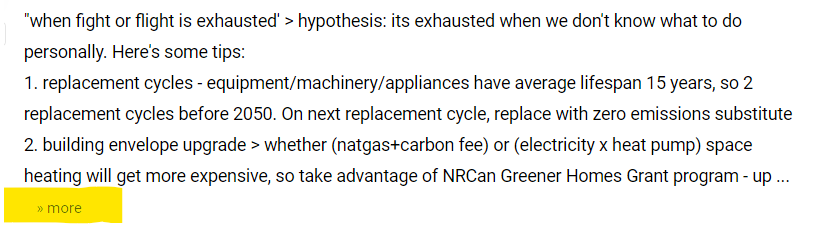
Longer comments require clicking a “» more” link to reveal hidden text
Comments with multiple replies requires clicking a “SHOW 2 OLDER REPLIES” to show more replies.
![]()
The scraping method needed to accomodate these. In order to see all of the comments and their complete text we would need a process that would effectively click through all of the buttons above until all of the comments and their content was displayed on the webpage.
Once all of the content was visible on the webpage it could be saved locally and Python BeautifulSoup could be used to extract all comments and their content and save it in a tabular data format.
Using Chrome browser’s “Inspect”, “View pge source” (Ctrl-U) and “Developer tools” (Ctrl-Shift-i ) quickly revealed the relevant HTML tags behind the buttons identified above. These are the things that need to be “clicked” again and again until all the comments and their content are displayed on the webpage.
Comments include a timestamp when it was posted, comment text, and comment user name, and if it is a reply, then name of the comment user being replied to.
Relevant code is provided below and can be found in this Github repository.
View complete list of CBC comments visualizations here.
// SHOW MORE COMMENTS
// div tag will have style="display: none;" if there are no more comments otherwise it is displayed
<div class="vf-load-more-con" style="display: none;">
<a href="#" class="vf-load-more vf-text-small vf-strong">Show More</a>
</div>

// SHOW REPLIES
// div tag will have style="display: none;" if there are no more comments otherwise it is displayed
<div class="vf-comment-replies hidden">
<a class="vf-replies-button vf-strong vf-text-small" href="#">Show <span class="vf-replies">0</span> older replies</a>
</div>

// SHOW MORE COMMENT TEXT
// tag is displayed only when comment has hidden text otherwise the tag is not present
<a href="#" class="vf-show-more" data-action="more">» more</a>
The button clicking was somewhat automated using the Javascript below executed in the Developer tools console. The process currently requires pasting the code into the console and manually executing it. Step 1 required some babysitting to ensure it runs to completion satisfactorily.
The workflow to show all comments and their content is as follows:
-
- Step 1: Run “STEP 1 – Show more comments” javascript in browser console.
- Step 2: Run “STEP 2 – Show replies” javascript in browser console.
- Step 3: Run “STEP 3 – Show more comment text” javascript in browser console.
At this point, all the comments and their content are displayed on the webpage.
-
- Step 4: Save webpage locally.
- Step 5: Run Python script to scape local webpage and save data as csv file.
- Step 6: Open csv in Excel or analyse using your favourite data visualization tool.
//STEP 1 - Show more comments - pages with 1000's of comments gets slower and show button exceeds 5000 ms so requires manual rerun of script

var timer = setInterval(getMore, 5000);
function getMore() {
    moreDiv = document.getElementsByClassName('vf-load-more-con')[0];
    if(moreDiv.style.display === "none") {
        console.log('vf-load-more comments finished');
        clearInterval(timer);
        return;
    }
    console.log('More comments');
    moreDiv.childNodes[0].nextElementSibling.click();
}

//STEP 2 - Show replies - loops to auto show all comments' replies

var buttons = document.getElementsByClassName('vf-replies-button');
console.log(buttons.length, 'vf-replies-button')
for(var i = 0; i <= buttons.length; i++) {
    buttons[i].click();
    console.log('click', i ,'of', buttons.length)
}
console.log('vf-rreplies-button finished');

//STEP 3 - Show more comment text - loops to show all commments' text

var buttons = document.getElementsByClassName('vf-show-more');
console.log(buttons.length, 'vf-show-more buttons')
for(var i = 0; i <= buttons.length; i++) {
    buttons[i].click();
    console.log('click', i, 'of',buttons.length)
}
console.log('vf-show-more comment text finished');
Once all the comments and their content are displayed on the webpage, Step 4 is to save the webpage locally. You need to save as complete html page to save the javascript otherwise the page will be blank.
Then Step 5 is to run the following Python code to extract comment data into csv file.
This uses Python BeautifulSoup to extract HTML tag data into a Pandas dataframe which is then saved locally as a csv file.
import sys, os
import csv
import re
from datetime import datetime, timedelta
from bs4 import BeautifulSoup
import pandas as pd

file_path_html = 'C:/cbc_comments/html/'
file_path_csv = 'C:/cbc_comments/data/'

file_url = 'https://www.cbc.ca/news/politics/trudeau-carbon-tax-global-1.6233936'

file_name = file_url.replace('https://www.cbc.ca/news/','').replace('/','_') + '.html'

soup = BeautifulSoup(open(file_path_html + file_name, encoding='utf8').read(), 'html.parser')

publish_date_raw = soup.find('time', class_='timeStamp')['datetime'][:-5]
publish_date = datetime.strptime(str(publish_date_raw), '%Y-%m-%dT%H:%M:%S')
vf_comments = soup.find('div', class_='vf-comments')
vf_comment_threads = soup.find_all('div', class_='vf-comment-container')
vf_usernames = soup.find_all('button', class_='vf-username')

# create comment data list of lists
comment_data = []
replies = []

for thread in vf_comment_threads:
    # children = data_ids.findChildren()
    # div_data_id = soup.find('div', class_='vf-comment')
    data_id = thread['data-id']
    username = thread.find('button', class_='vf-username').get_text()
    comment_time_str = thread.find('span', class_='vf-date').get_text().replace('s ago', '')
    comment_time_int = int(re.sub('[^0-9]', '', comment_time_str))
    if 'minute' in comment_time_str:
        elapsed_minutes = comment_time_int
    if 'hour' in comment_time_str:
        elapsed_minutes = comment_time_int * 60
    comment_text_raw = thread.find('span', class_='vf-comment-html-content').get_text()
    comment_time = publish_date - timedelta(minutes=elapsed_minutes)
    if 'Reply to @' in comment_text_raw:
        comment_type = 'reply'
        replied_to_user = comment_text_raw.split(": ",1)[0].replace('Reply to @', '').strip()
        try:
            comment_text = comment_text_raw.split(": ",1)[1].strip()
        except:
            comment_text = 'no text'
    else:
        comment_type = 'parent'
        replied_to_user = ''
        comment_text = comment_text_raw.strip()

    comment_data.append((
        data_id,
        publish_date,
        comment_time,
        username,
        comment_type,
        replied_to_user,
        comment_text,
        file_name.replace('.html', ''),
        file_url))

df_comment_data = pd.DataFrame(
    list(comment_data),
    columns=[
    'data_id',
    'publish time',
    'comment_time',
    'comment_user',
    'comment_type',
    'replied_to_user',
    'comment_text',
    'file_name',
    'file_url'])

df_comment_data.to_csv(
    file_path_csv + file_name.replace('.html', '.csv'),
    encoding='utf-8',
    index=False)
Now that we have created a nice tabular format csv data file we can analyse the data using your favourite data analysis and visualization tools.
Read this other post that describes some of the data analysis and visualization done on this data.