This tennis rank visualization can be viewed at 009co.com/public_data/tennis_data.
Introduction
In the world of tennis, understanding the dynamics between player rankings, match outcomes, and betting odds can offer fascinating insights into the sport. To showcase my technical and analytical capabilities, I have created a visualization using data from tennis-data.co.uk, which provides up-to-date information on men’s and women’s tennis tournaments, including match winners, losers, and betting odds.
Visualization Overview
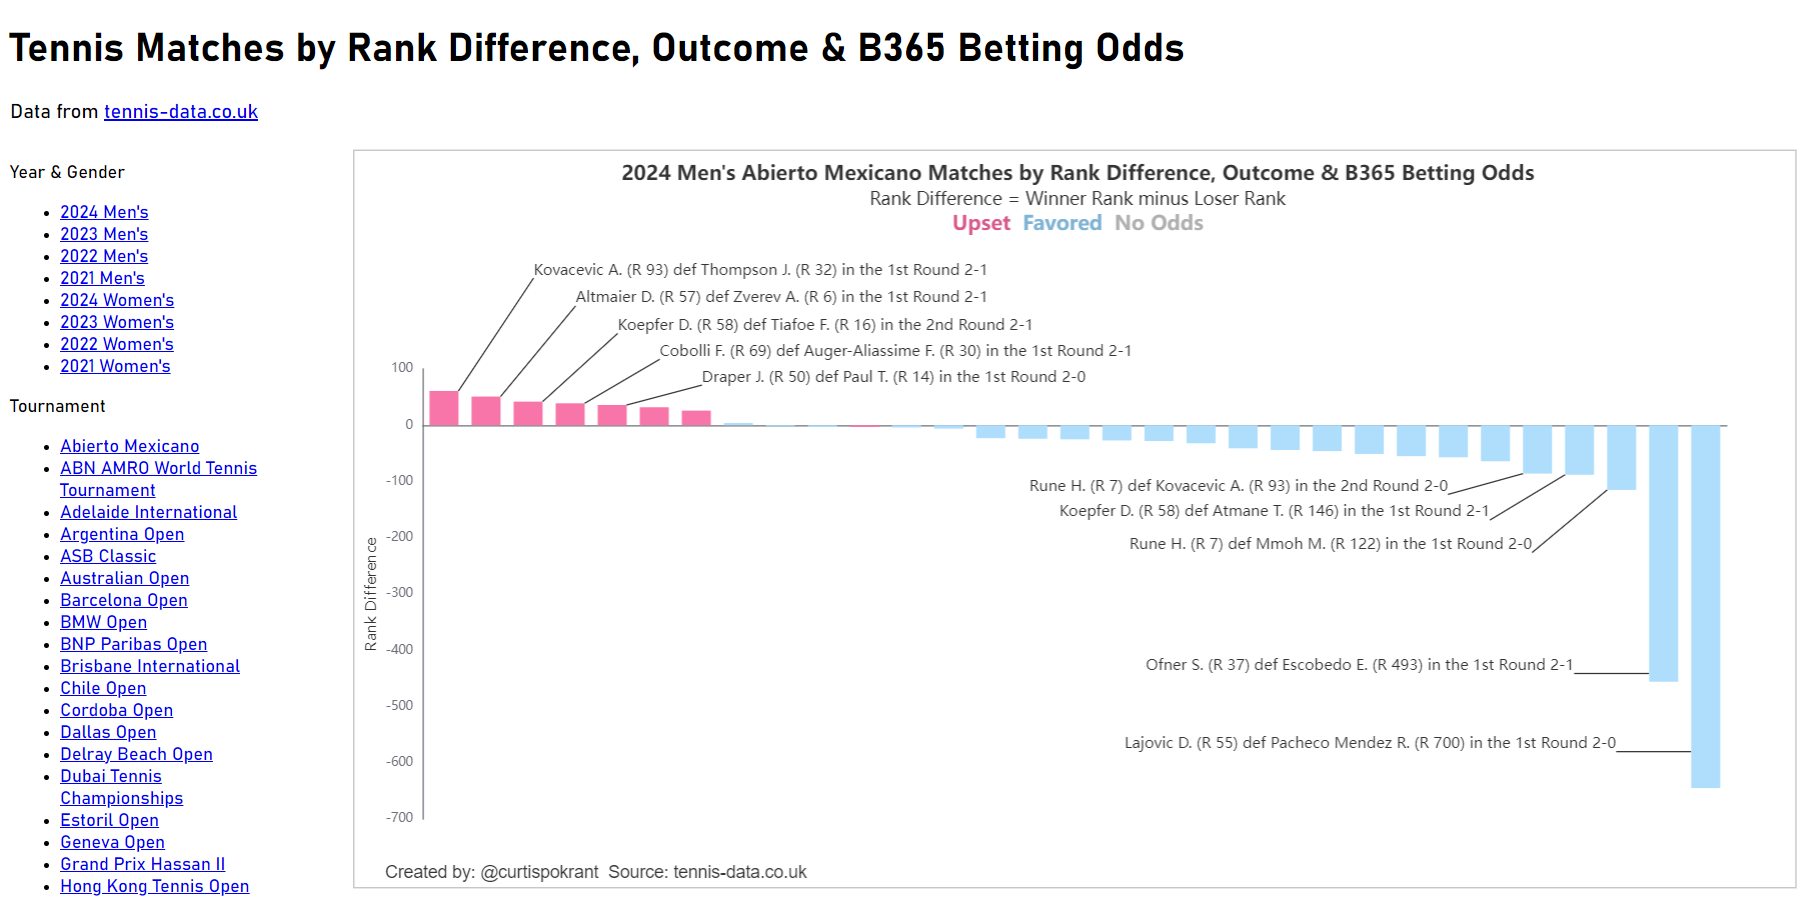
The visualization employs EChart.js, a powerful JavaScript library for creating interactive charts and visualizations. The data used includes player ranks, match outcomes, and betting odds, enabling an analysis of how often lower-ranked players upset higher-ranked players, and how these outcomes align with or deviate from betting odds.
Technical Implementation
Tools and Technologies:
- JavaScript: The core programming language used to manipulate data and create the visualizations.
- EChart.js: The library used to design and render the charts.
- Data Source: The dataset was sourced from tennis-data.co.uk, which provides comprehensive data on tennis matches, including player ranks, outcomes, and betting odds.
Data Processing:
- Data Collection: Data was fetched from tennis-data.co.uk, which includes information on player rankings, match results, and betting odds.
- Data Cleaning: Ensuring the dataset is clean and ready for analysis, including handling missing values and ensuring consistent data formats.
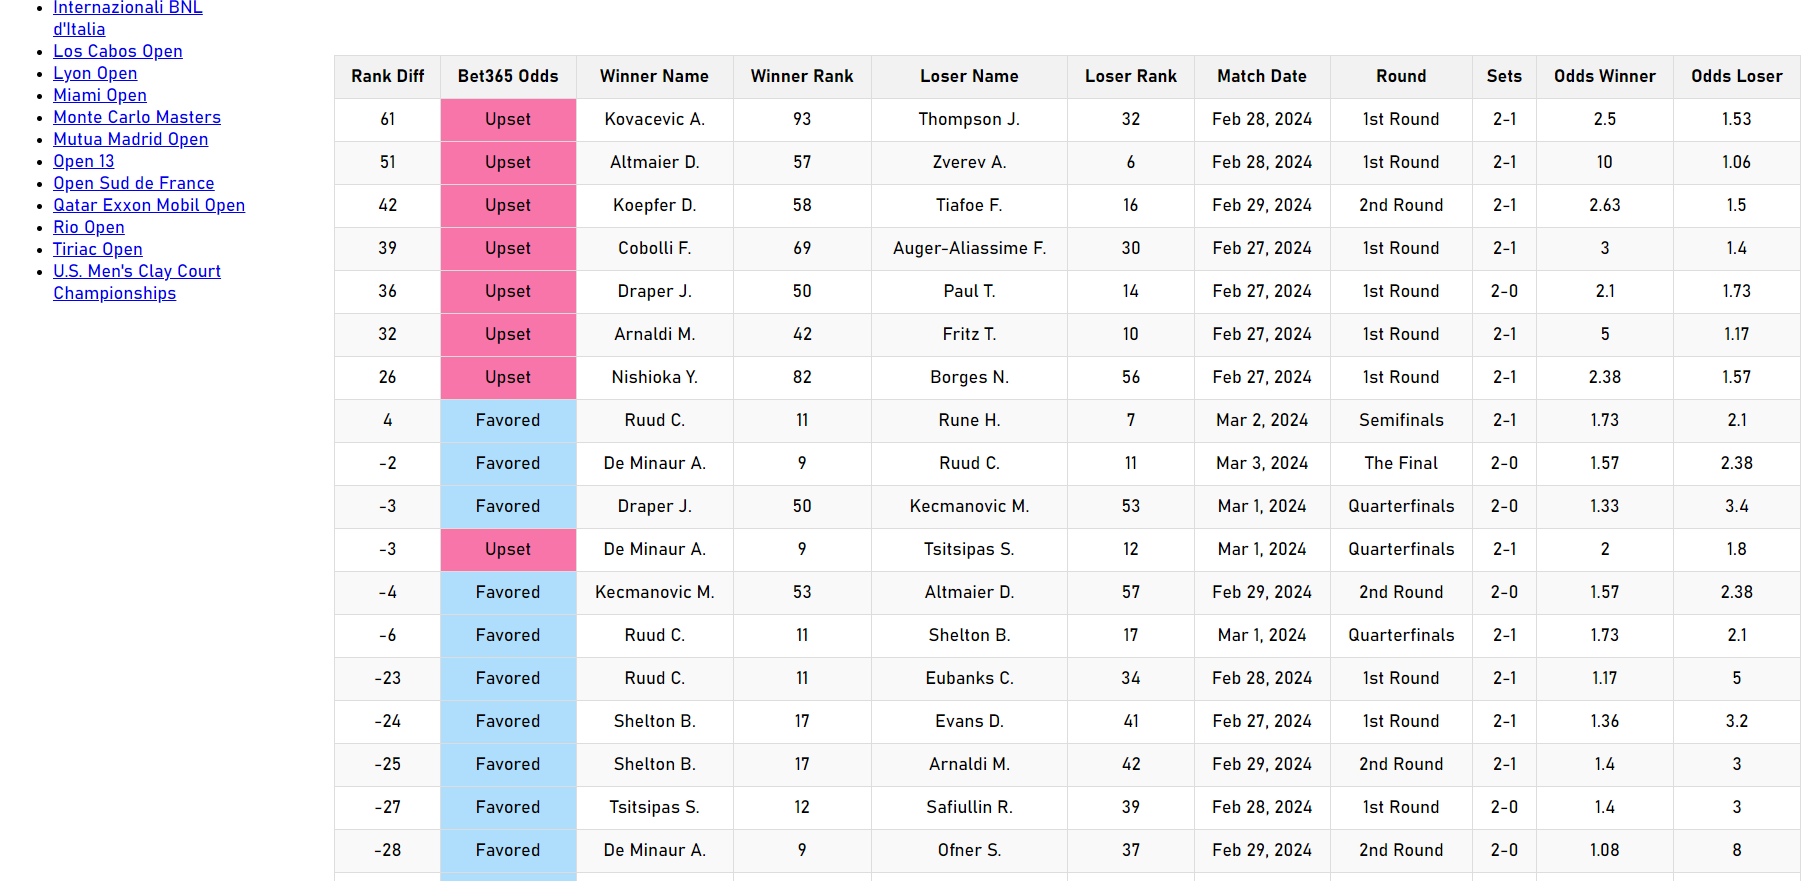
- Data Transformation: The dataset was transformed to calculate the rank differences, and outcomes were categorized based on whether the match resulted in an upset or a favored win.
Visualization Details:
- Color Coding:
- Pink: Represents match upsets where the winner had lower odds of winning.
- Blue: Represents outcomes where the favored player won.
- Gray: Indicates matches without betting odds.
- Annotations: Key matches are annotated to highlight significant upsets and favored wins.
Analytical Insights
The visualization provides several analytical insights:
- It clearly shows instances where lower-ranked players defeated higher-ranked opponents against the odds, highlighting unexpected outcomes in the tennis world.
- The color-coding makes it easy to distinguish between upsets and expected outcomes, offering a quick visual summary of the tournament dynamics.
- By analyzing these patterns, one can gain a deeper understanding of player performance and the reliability of betting odds in predicting match outcomes.
Conclusion
This visualization is a powerful tool for tennis enthusiasts, analysts, and bettors. It not only showcases the technical skills involved in data processing and visualization but also provides valuable insights into the sport of tennis. By leveraging technologies like EChart.js and JavaScript, we can transform raw data into meaningful, interactive visual narratives.
For a closer look at the visualization and to explore the data further, visit 009co.com/public_data/tennis_data.