Google Watch and Fitbit devices actually record a lot of detailed data that you may never see in the Fitbit app. For example, while the Fitbit app shows only a single average SpO2 value for a night’s sleep, SpO2, along with HRV and heart rate are recorded every few seconds. In order to see the SpO2, HRV and heart rate measurements recorded at seconds intervals you need to get the data from the Fitbit Web API. This post discusses how the data can be retrieved, analysed and visualized.
Getting Fitbit Web API data
I’ve created an full stack application that retrieves data from the Fitbit Web API, saves data in a MongoDB database, and visualizes data in web pages using HTML, Node.js and Plotly.js.
The application code is freely available in this Github repository:https://github.com/sitrucp/fitbit_data_viz
This repo code contains:
- Backend – Python code that connects to and retrieves the Fitbit Web API data as json files and then inserts these into a MongoDB database.
- Frontend – HTML, Node.js and Plotly.js code to connect to the MongoDB database to get and visualize the data. Screenshots of some of the visualizations are provided below.
Technical highlights:
- PyCherry used to pop Fitbit authentication login browser window.
- Fitbit authentication token is saved locally as json file (auth_tokens.json).
- Uses refresh token used to get new tokens automatically.
- Response log (response_log.json) records the last API call response date for each API endpoints.
- Activity log (activity_log.json) records retrieval activity including response errors and messages.
- Transformation of the data occurs as part of the process that loads the data into MongoDB using Python, and some of it occurs when the data is retrieved from MongoDB using Node.js javascript code and HTML page Javascript.
- Very helpful feature is a process to authenticate connections to the Fitbit Web API and maintain persistent saving and refreshing authentication tokens for subsequent connections.
Menu of individual detailed visualizations
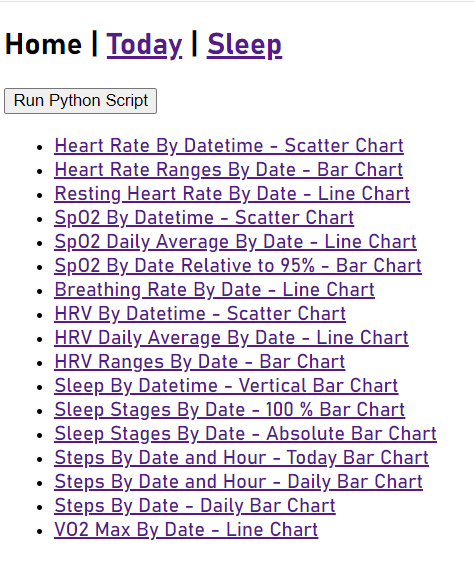
The frontend home page is a table of contents linking to all visualizations available.
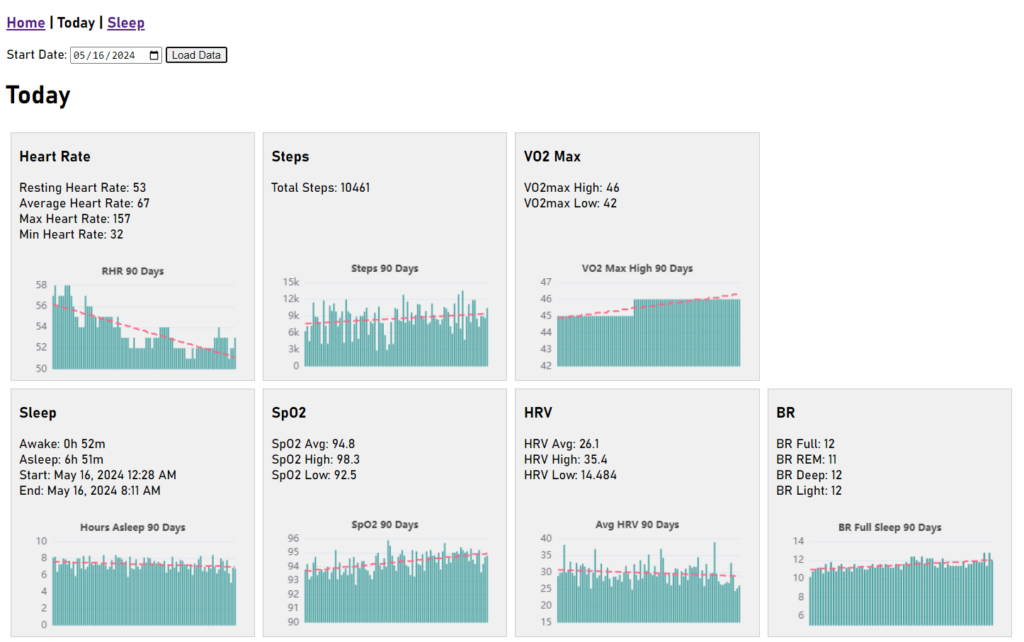
Today – summary snapshot
Summary of the past 90 day’s activity.
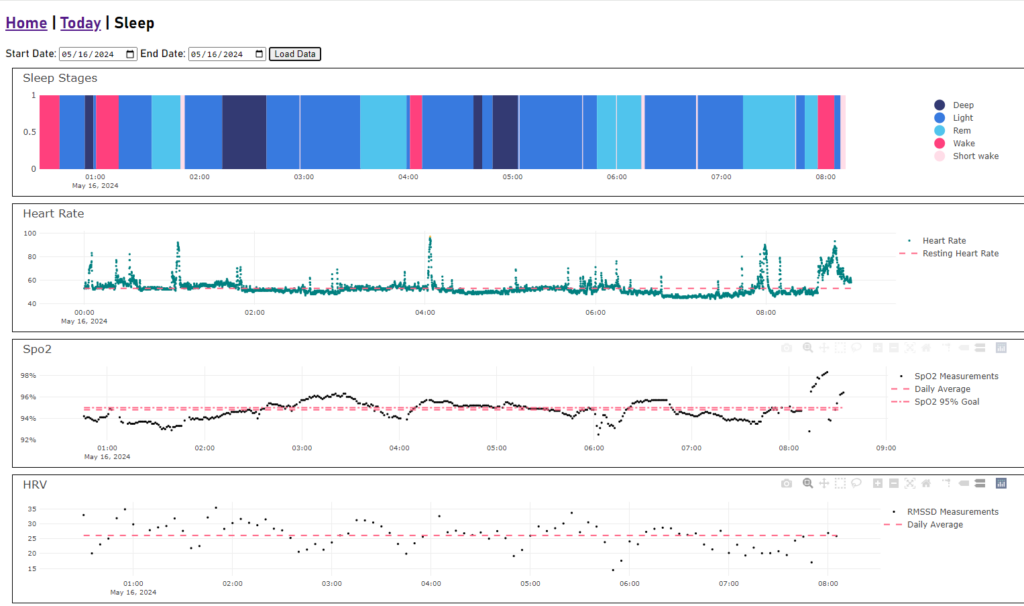
Sleep – previous night’s sleep detail
Set of visualizations of the previous night’s detailed sleep activity as well as SpO2, heart rate and HRV. Standard Fitbit data presentations in the app and on the web do not contain this granular second level detail which is captured by the device and available through the Web API.