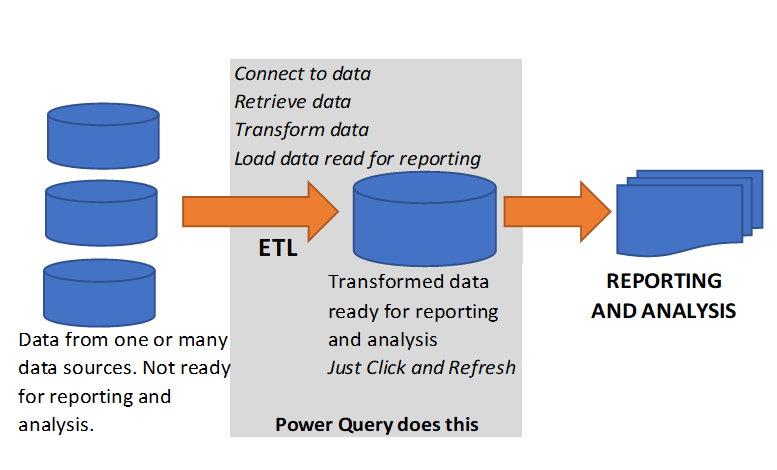
What is Power Query?
Power Query is an Microsoft tool for Excel and Power BI that is used to do the following:
-
- Connect to a data source
- Extract data from source
- Transform the extracted data
- Load the transformed data into Excel
This functionality is called ETL (Extract, Transform and Load).
Why use Power Query?
Excel already has another tab of features called Get External Data, why not use that?
-
- Excel’s other methods for connecting to and retrieving data may still be useful, but they are not able to transform the data.
- Power Query connections are non-techie, user friendly, and provide much more versatile and robust functionality.
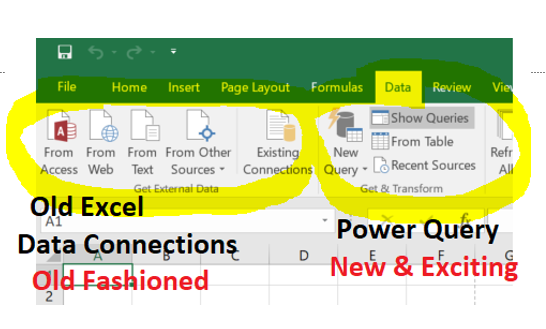
Where is Power Query in Excel?
You can find Power Query in the Data tab Get & Transform icon group in Excel 2016
Note that in previous versions of Excel, Power Query is an add-in that has its own tab. However, in Excel 2016 Power Query is built into Excel.
Get & Transform has 4 icons:
-
- Show Queries – this hides/shows the Query pane docked on right side of Excel.
- New Query – choose data source & modify Power Query settings and options.
- From Table – choose data source as currently selected Excel table.
- Recent Sources – choose from recently selected data sources.
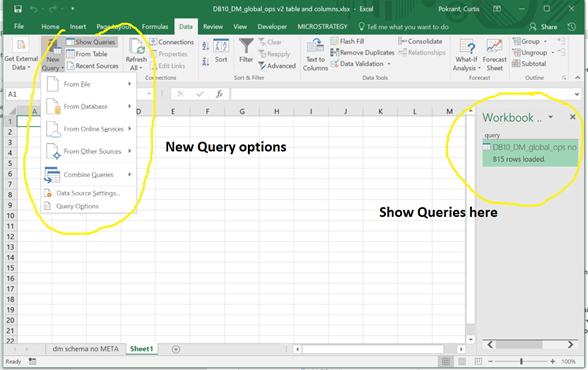
Step 1 – Connect to a data source and retrieve data
Select the New Query icon to select which type of data you want to connect to
-
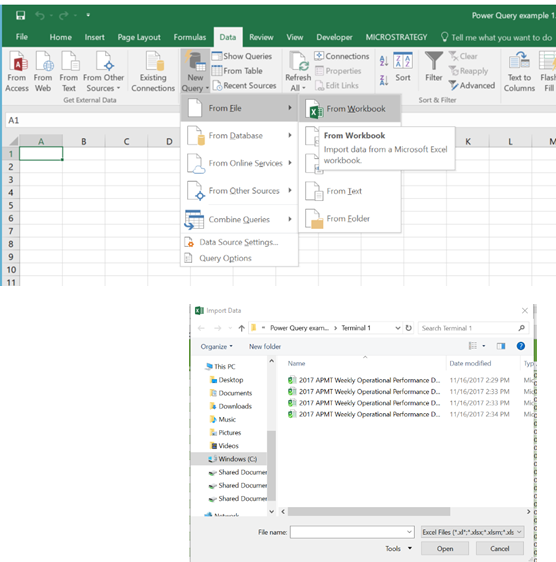
- FromFile (csv, Excel)
- FromDatabase (SQL Server db, Access db)
- FromOnline Services (Facebook)
- From Other Sources (webpage, SharePoint List, ODBC connection)
Screenshot shows example of connecting to an Excel Workbook.
-
- Select From File – From Workbook
- Popup dialogue allows you to select an Excel file.
Step 2 – Transform the data – common usage
-
- “Calculated columns” replace any worksheet formula requirement
- Power Query has many more formulas than plain old Excel, including VBA type functionality
- Power Query has been called “vlookup on steroids”
- “Pivot” and “unpivot” data
- Group and aggregate data into sums, min, max, averages
- Simple to combine many files contents in a folder into one table.
- Filter, sort, replace with complex logic.
- Merge two or more separate tables of data together on matching values. If you are familiar with SQL, this is a JOIN query.
- Append two or more separate tables of data into one combined table of data. If you are familiar with SQL, this is a UNION query.
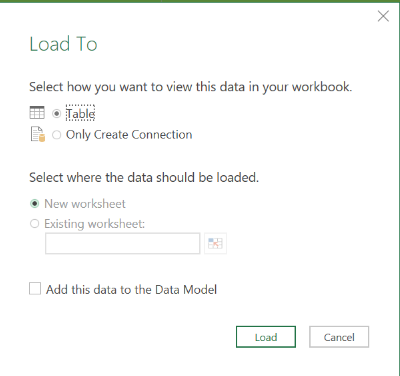
Step 3 – Load the data into Excel
-
- Power Query queries are loaded to a worksheet by default.
- However, you can choose to save a query as a connection only by selecting Load To – Only Create Connection. This query can be used in other Queries eg in Merge or Append, and by other Excel features eg it can be used as datasource for a Pivot Table.
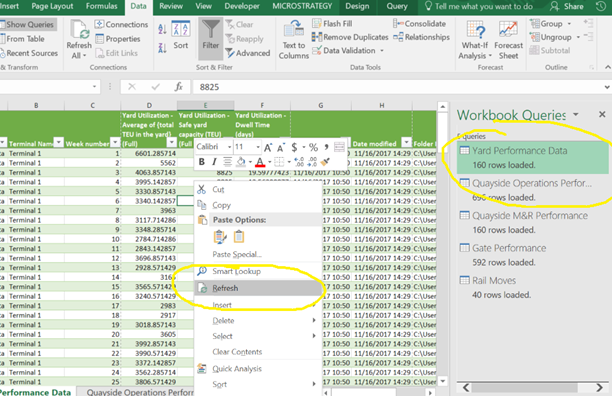
Step 4 – Click and refresh to retrieve new data
-
- When data source(s) are updated, just click Refresh to retrieve and transform new data.
- No copy & paste of data from other files.
- No worry about formulas being deleted or ranges being moved.
- All transformations are safely contained inside the Query.
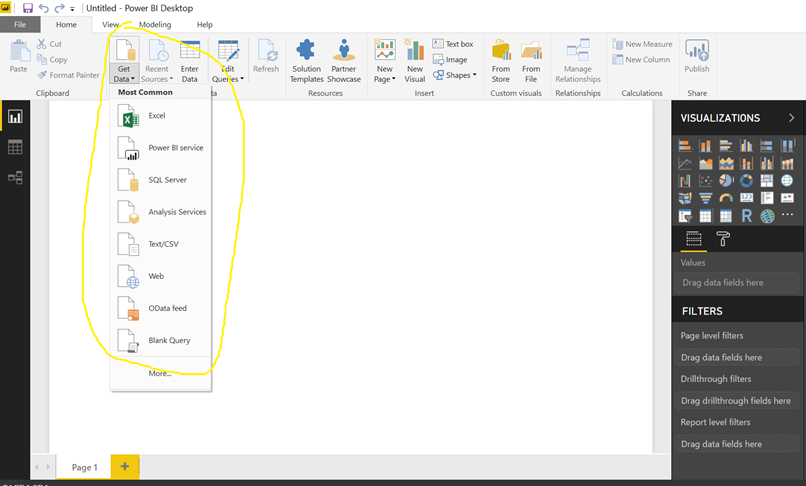
Bonus: Power Query is also in Microsoft Power BI
-
- Power Query has been integrated into Power BI as the “Get Data” feature.
- Has the same functionality and features as the Power Query in Excel.
- Same programming language ‘M’.