Statistics Canada regularly tweet links to various Canadian statistics. I have occasionally created quick Tableau visualizations of the data and replied with a link to my Tableau Public site.
The idea is to encourage Statistics Canada to start communicating more visually and create their own visualizations for all data. Its extra work but value will be realized when Statistics Canada visitors can more easily understand the data instantly by looking at visualizations instead of munging about with boring data in tables.
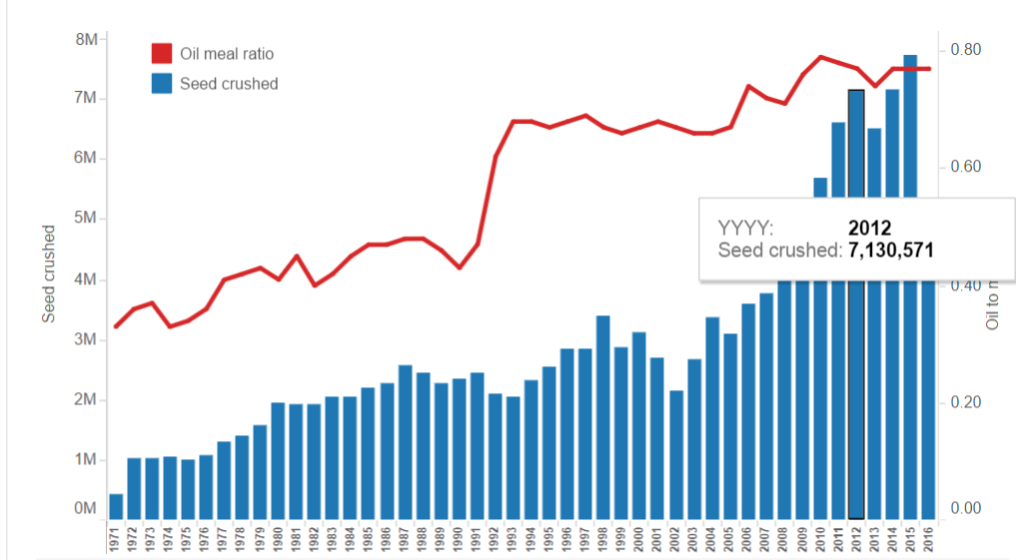
This particular tweet was to Statistics Canada data reporting on Canadian canola seed crush, canola oil and meal output. http://www5.statcan.gc.ca/cansim/a47
The data shows Canada’s canola seed production and efficiency at extracting canola oil has increased significantly since 1971.
Canola seed is crushed to extract the oil and the seed meal is leftover. The ratio of oil to meal is about .8 in 2016 compared to .3 in 1971. That is a impressive increase in oil extraction efficiency.
