During the early days of the 2020 COVID-19 pandemic in Canada, I wanted to get better understanding of the geographical distribution of COVID-19 cases across Canada.
At the time, government or news agencies were only mapping case counts by province. However Canadian provinces are so big compared to population centers that it doesn’t accurately reflect actual geographic distribution of cases. It would be better to use the provincial “health regions” which correspond much better to population centers.
So I set about to create for myself a choropleth map visualization by health regions.
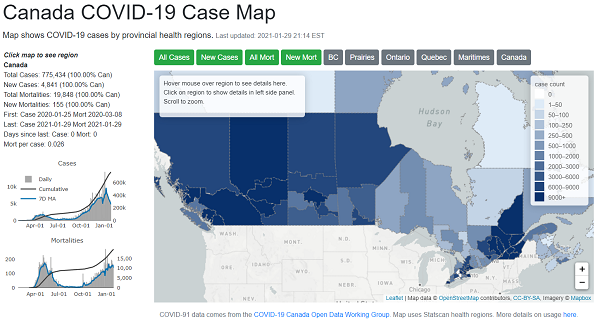
View the finished choropleth map at the following link. The source data is updated daily each evening.
https://sitrucp.github.io/canada_covid_health_regions/index.html
I used Leaflet.js open-source JavaScript mapping library to create the interactive choropleth map, D3.js to retrieve and transform the csv format data, and Javascript to retrieve the JSON geographic boundary files and also to manipulate and present the data with HTML and CSS.
The COVID-19 case count data are obtained as csv file format from the “COVID-19 Canada Open Data Working Group” who are an amazing group of volunteers. They have been tirelessly collating data from the various provincial and territory government agencies daily since early March. This group saves the collated and cleaned data as csv files in a Github repository https://github.com/ishaberry/Covid19Canada.
The health region geographical boundary descriptions are from Statistics Canada’s Statscan ArcGIS Health region boundary Canada dataset. These had very detailed boundaries so I simplified them using QGIS which also dramatically reduced the dataset size.
However, there were some data issues that needed to be addressed first. The Statscan health regions shape file boundary names are different than those used by the provincial and territory government agencies reporting the data.
The Statscan seems to have full-form “official” health region names, while the provincial and territory government agency names are common, more familar, short-hand names. Also, names appeared to have changed since they were recorded in Statscan data.
Provinces may also add or remove health regions from time to time due to administrative changes or population changes etc. So either set may have health regions that the other doesn’t have.
From a data governance perspective, in a perfect world, everyone uses a single set of health region boundary names. COVID-19 reporting has made a lot of people aware of this issue which is a silver lining in the COVID-19 dark cloud!
Addressing these name differences was actually quite simple, requiring creation of a lookup table with two columns, one for each dataset, to match the names in the boundary data files to the names in the counts data file. The lookup table can then be used dynamically when getting data each time the map is refreshed. This is described in more detail in Github repository README linked below.
Code for this project is maintained in Github: github.com/sitrucp/canada_covid_health_regions.
I also created a separate choropleth map for Montreal, where I was living at the time, which was Canada’s COVID-19 “hotspot” with about 25-30% of Canada’s total COVID-19 cases. However, the Montreal data source has since been discontinued so the map is archived now.
View archived Montreal map here:
https://sitrucp.github.io/canada_covid_health_regions/montreal/index.html