This is based on City of Toronto’s Open Data website 311 call performance data for the 4 years 2010, 2011, 2012 and 2013.
The data is provided by the City in a Google Spread Sheet and has been downloaded and saved here in Excel 2013 format 311_daily_contact_centre_data.
I used Excel pivot tables and charts for analysis and visualization.
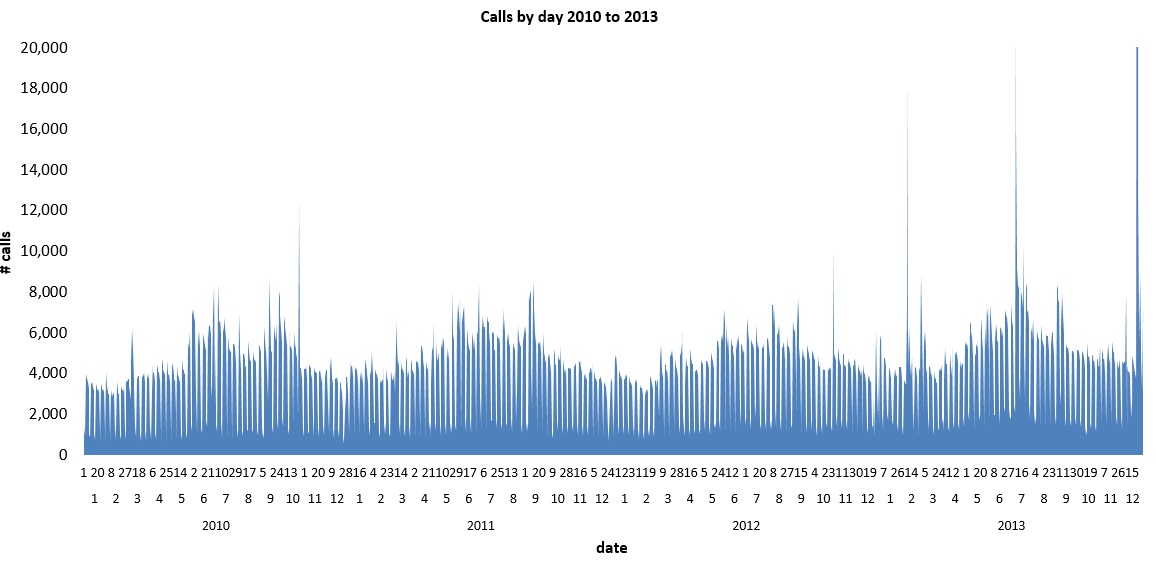
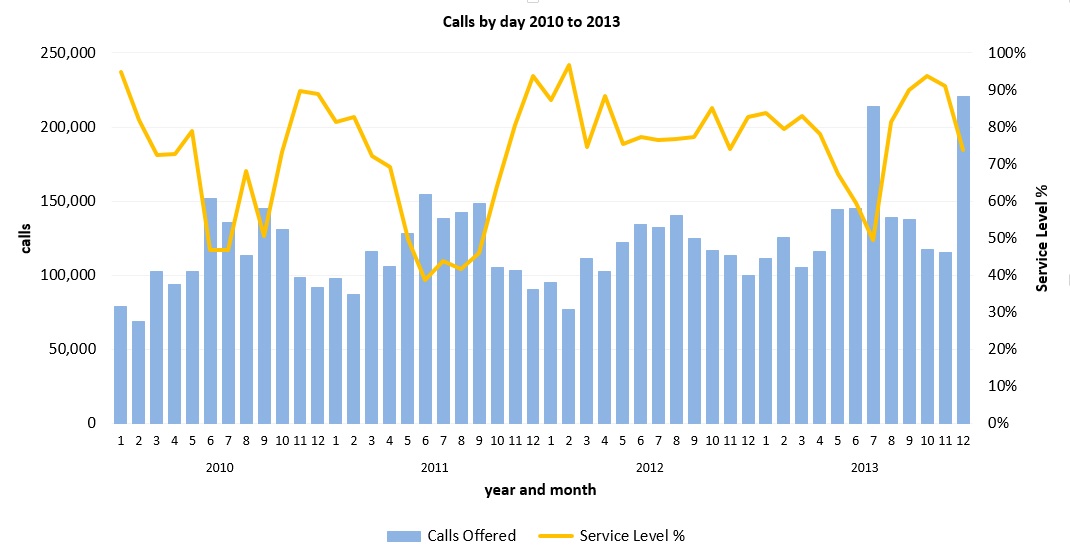
The call volume has remained relatively consistent year over year from 2010 to 2013. The chart below shows all daily calls from 2010 to 2013. On average there are about 5,000 calls per day. There are seasonal variations evident with peaks in summer and a few big spikes notably one at end of December 2013 where it spiked to over 20,000 calls per day. Not sure what that was.
Weekend calls volume is dramatically lower compared to weekday calls. That indicates that 311 calls are business related.
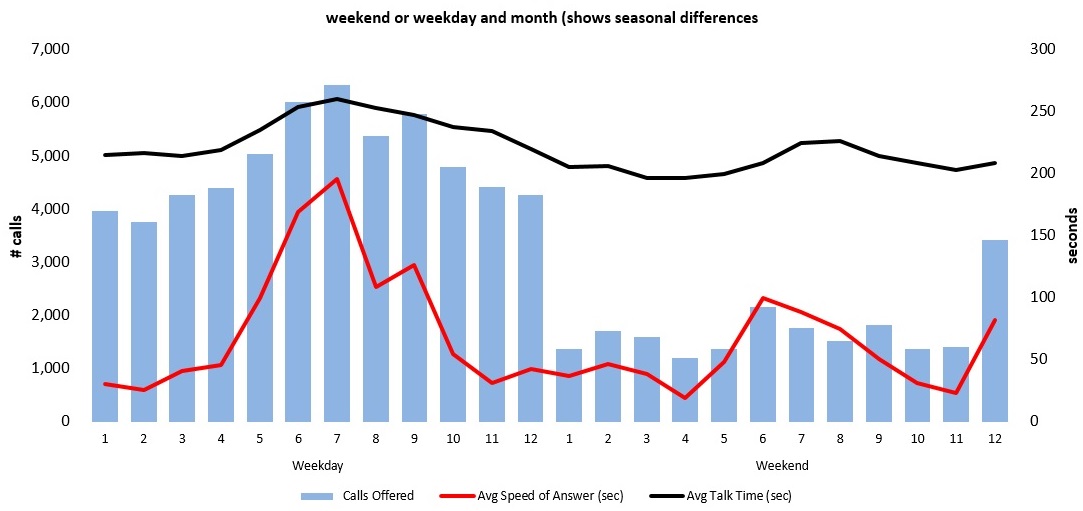
The 311 line keeps a fairly consistent average call talk time of 230 seconds or about 4 minutes as represented by the black line in chart below.
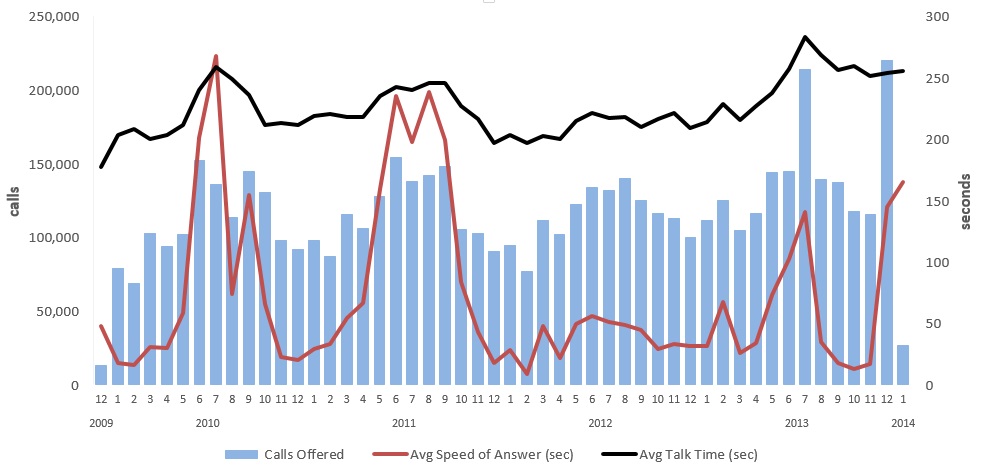
The average speed of answer metric varies quite a bit (red line in chart below). We can see that answer time follows call volume.
When a call center gets more calls it takes longer to answer the call. This indicates the call center has same number of agents available regardless of season, day of week or special event. It is probably too expensive and or challenging to hire staff to work part time or on call for these surge events. There are also some anomalously high call answer times that might be due to under staffing or equipment failures.
The grouping of calls, talk times and answer times by month in the chart below may obfuscate daily variations. Also daily outliers may skew the monthly totals but viewed month over month does a good job of showing trends.
The call center metrics around call abandonment are important measures. We will see near end of the post how this is used to create a ‘service level’ metric. The chart below shows a breakdown of how many calls are actually answered and connected to the a 311 Call Center agent.
- Only about 75% of the total calls that come into the 311 call centre are actually answered (blue part of bar).
- The remaining 25% of the calls are abandoned by the caller.
- On average, 15% are abandoned within 30 seconds (green part of bar). These people are busy, they won’t wait, and leave the hold queue relatively quickly.
- On average, 10% wait longer than 30 seconds before hanging up (red part of bar). These people invested their time in waiting on hold.

As mentioned above, the call center creates a ‘service level’ metric that is a percentage value based on abandoned calls and call answer time. When there are no abandoned calls the service level approaches 100%. However, the Toronto 311 call center has not hit 100% very often as shown by the orange line in chart below which is average service level percent by month. In fact it has never been 100% for any month over the 4 years.
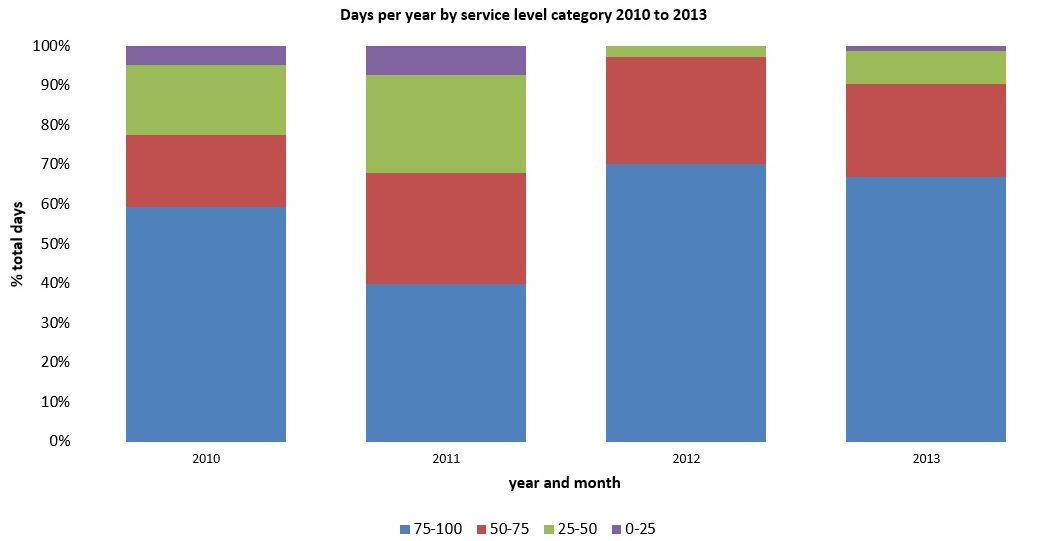
Another way to look at service level is to look at how many days met service level categories. The chart below groups daily service level counts into the following categories: 0-25%, 25-50%, 50-75% and 75-100%. Roughly only 70% of the total days in 2012 and 2013 were in the 75-100% service level.
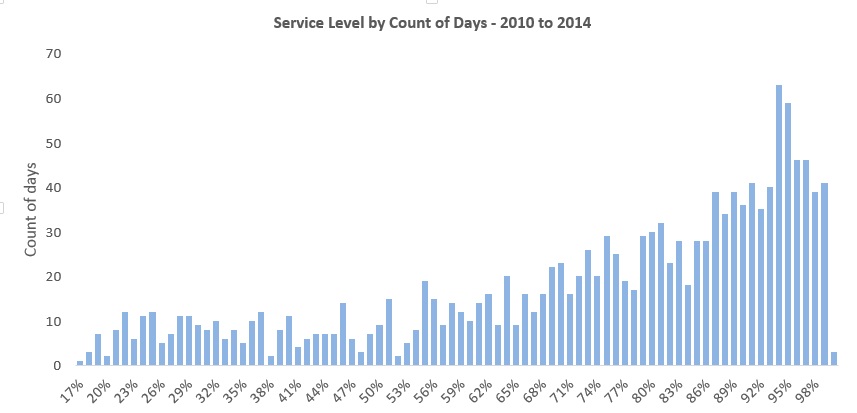
Yet another way to look at the service level is to look at the service level daily attainment frequency over the 4 years. The chart below shows service level daily frequency. For example service level of 100% was attained only for 4 days from 2010 to 2013. This view provides more granularity on call center service levels.
This analysis suggests that the call center needs to increase its service level metric. Since service level is largely dependent on call abandonment, something needs to be done decrease number of calls sent to hold which results in 25% of callers waiting but then hanging up. What can a call center do about this?
- Increase number of agents to answer calls is the most obvious action. The challenge is they should be part time or shift workers to handle spikes in call volume.
- Reduce call talk time so agents can answer more calls and reduce calls sent to hold and abandoned calls. This can be done by improving training or more making information more accessible to the agents so they can answer questions faster and more efficiently.
- Instead of putting callers on hold offer them the option to alternative information channels perhaps to an interactive automated voice or interactive website.
- Do analysis of reasons people are calling 311 and endeavour to provide that information proactively in other channels eg on City websites, billboards, or other public communication channels.
The 311 call center data is available at the City of Toronto Open Data website with their catalogue name “311 Contact Centre Performance Metrics”.