For a 16 month period, from February 2020 to June 2021, TendiesTown.com used the Reddit API in an automated process to retrieve r/wallstreetbets posts tagged with “Gain” or “Loss” flair. The subReddit r/wallstreetbets is a stock and option trading discussion board that gained popularity during the 2020/2021 “meme stock” media frenzy.
The retrieved posts were automatically categorized by gain or loss, post date, Reddit username, trade verification image url, and post url.
These posts were then manually processed to identify the gain or loss amount and reported stock ticker(s).
As of June 9, 2021, there were 4,582 trades with 2,585 gains and 1,997 losses recorded. Gain amounts totalled USD $389 million and losses USD $117 million.
While 6,844 posts were retrieved from the subreddit, 2,262 (33%) of these were rejected because they were either duplicate posts, not actual gain or loss trades (per r/wallstreetbets flair guidelines) or it was not possible to identify the amount.
The trades and more detailed analysis are available on the tendiestown.com website. As of June 9, 2021, the manual processing is no longer being done, so no new data will appear on the site.
“Gain” and “Loss” flair are described in more detail in the community flair guidelines but essentially “Gain” = trade made money and “Loss”= trade lost money.
Table 1: Summary statistics
| Gains | Losses | |
| Count | 2,585 | 1,997 |
| Sum | $389,329,571 | $117,347,985 |
| Avg | $150,611 | $58,762 |
| Median | $24,138 | $12,120 |
| Min | $138 | $100 |
| Max | $8,000,000 | $14,776,725 |
The 4,582 trades were made by 3,903 unique Reddit users. 492 of these Reddit users have more than one trade as shown in table 2 below.
Table 2: Trade counts by unique Reddit users
| # trades | count of Reddit users |
| 1 | 3,411 |
| 2 | 378 |
| 3 | 73 |
| 4 | 22 |
| 5 | 11 |
| 6 | 5 |
| 7 | 1 |
| 8 |
2 |
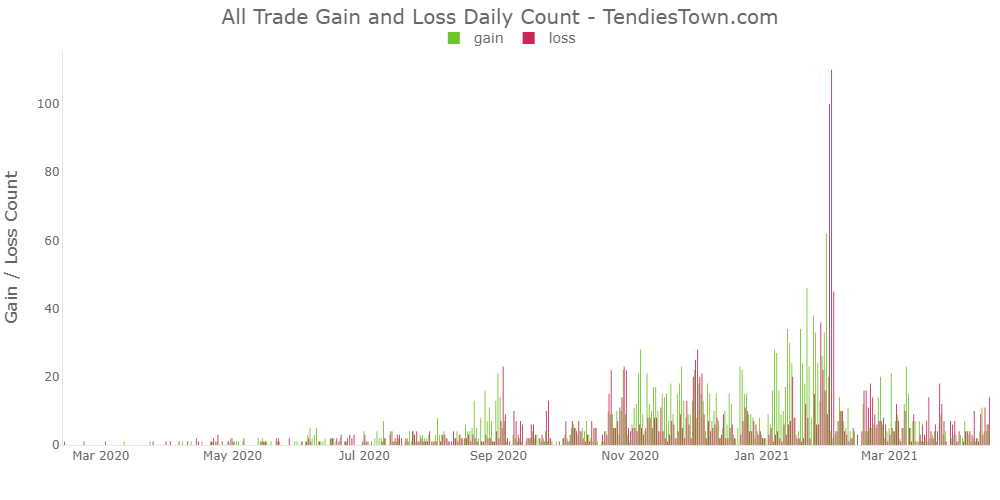
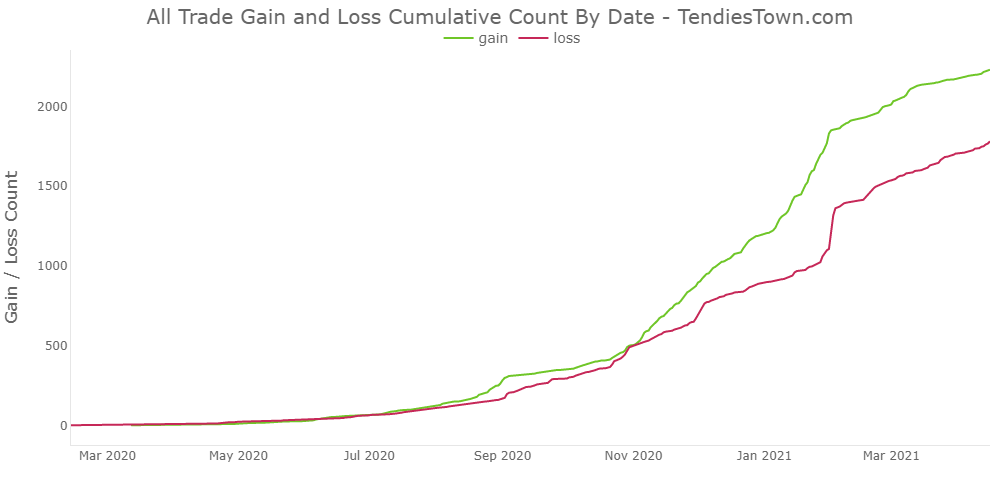
Charts 1 & 2: Daily and cumulative counts
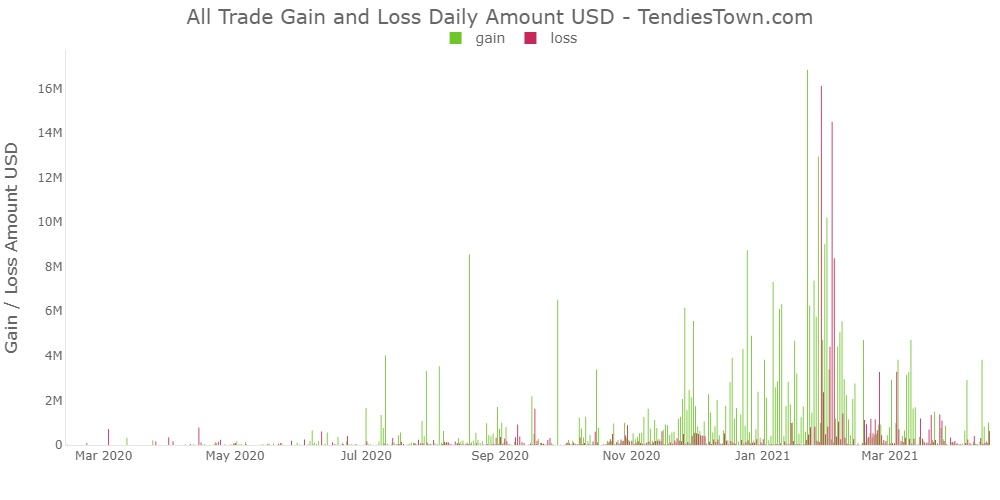
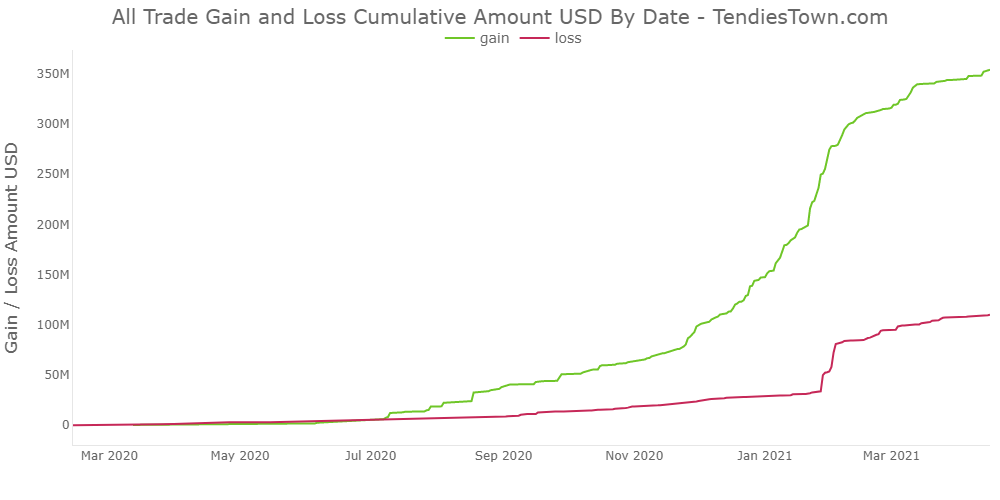
Charts 3 & 4: Daily and cumulative amounts
Notable observations
Early 2021 increase in trades
The count and amount of trades rose significantly in the early months of 2021. This can be explained by the surge of new users to the r/wallstreetbets subreddit due to huge increase in popular media reporting surrounding the GME, AMC meme stock craze.
Gains greater than losses
Gains consistently lead losses over the 16 month period. Rather than simply concluding that r/wallstreetbets traders gain more than they lose, it suspected that the variance can be explained due to fact that it is easier to tell the world that you won, and harder to say you have lost.