This cool periodic chart of the elements shows source / origin of the chemical elements. Source: Wikipedia created by Cmglee

It was really interesting to learn that elements may be created from more than one source/origin which are listed below:
-
- Big Bang fusion
- Exploding white dwarfs
- Exploding massive stars
- Cosmic ray fission
- Merging neutron stars
- Dying low-mass stars
- Human synthesis
After learning this, I wanted to see counts of elements by origin. At first I thought I might have to do some manual data entry from the graphic.
However, after a bit of digging, it turned out that the author of the SVG file shown above had embedded the data I wanted along with Python code necessary to create the SVG file inside the file, which is very cool!
With some minor modification to the SVG file Python code I was able to extract the data into a csv data file and then use that as data source for the visualizations of counts of elements by origin below.
Read more about the SVG and the Python code modifications that I made in this Github repository: https://github.com/sitrucp/periodic_elements.
The first chart below shows the counts of elements by their source/origin which answers my original question.
It was very interesting to learn that only 4 elements were created by the Big Bang and that all of the rest of the elements were created afterwards, by source/origin that came into being after the Big Bang. 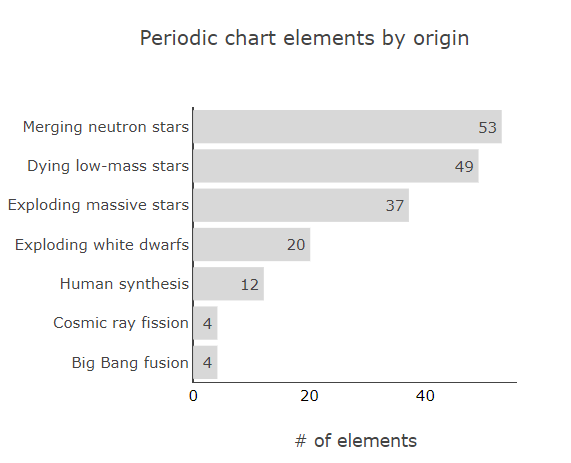
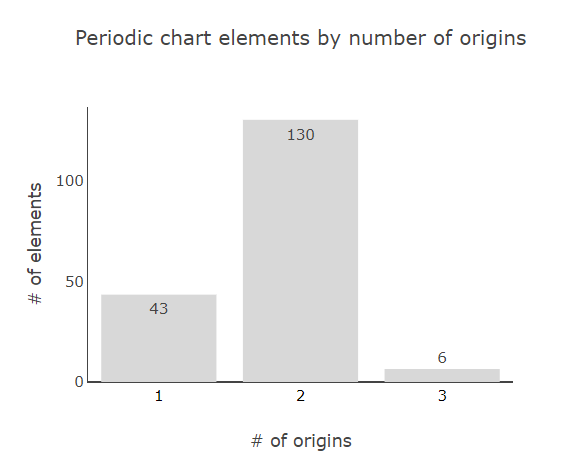
The second chart shows counts of elements by number of source/origin. It was also very interesting to also learn that some elements have more than one source/origin, and 136 elements have more than one source/origin.