Tableau

BC Executive Compensation Tableau Visualization

The Province of British Columbia publishes public agency executive compensation each year. The data is grouped by: Sector – Employers are categorized in one of six sectors – Colleges, Crown Corporations, Education, Health, Public Service, Universities Employer – Employers belong to one Sector. There are about 190 employers such as BC Assessment Authority, BC Housing Management Commission, BC Hydro, etc […]

BC Executive Compensation Tableau Visualization Read More »

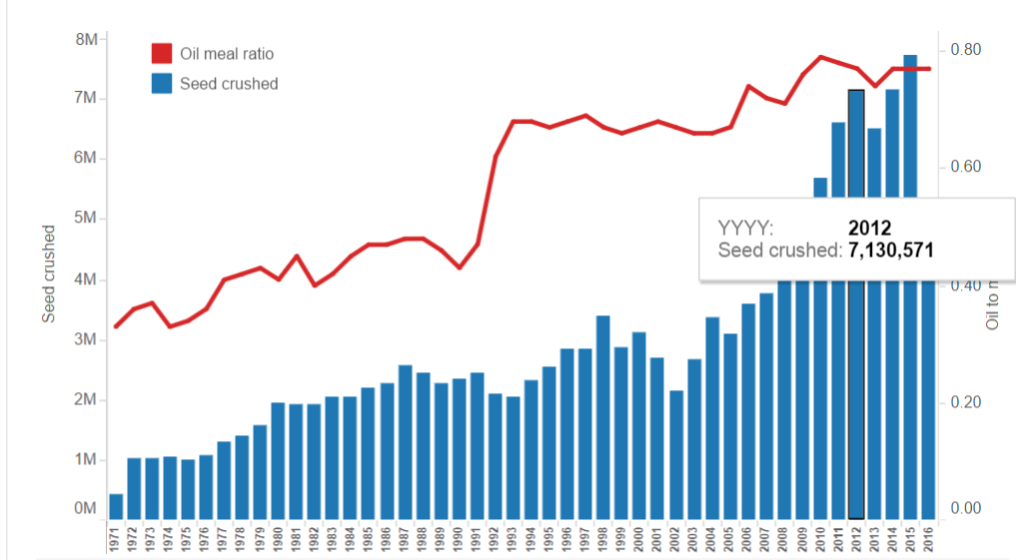
Canadian Canola seed crushing more efficient at extracting canola oil

Statistics Canada regularly tweet links to various Canadian statistics. I have occasionally created quick Tableau visualizations of the data and replied with a link to my Tableau Public site. The idea is to encourage Statistics Canada to start communicating more visually and create their own visualizations for all data. Its extra work but value will

Canadian Canola seed crushing more efficient at extracting canola oil Read More »

Canadian TCS FDI Officers Twitter list member analysis

Blog post updated to add the following: Updated Python “TCS Members Details” code to get additional information from the List members’ profiles. New Python code “TCS Members Tweets” to download all List members’ Tweets. ————————————————– The Canadian Trade Commissioner Service maintains a Twitter List named CDN TCS FDI Officers that has a bunch of Canadian Trade Commissioners as members.

Canadian TCS FDI Officers Twitter list member analysis Read More »

Scroll to Top