This is a list of Canadian COVID-19 related data analysis and visualization that I created during the 2020/21 pandemic to track vaccinations availability and delivery, and COVID-19 infections and deaths.
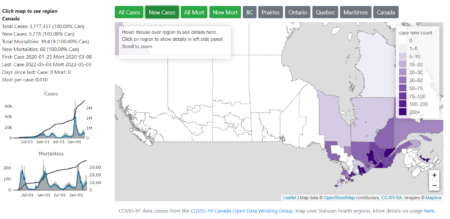
Canada COVID-19 Case Map –
https://sitrucp.github.io/canada_covid_health_regions
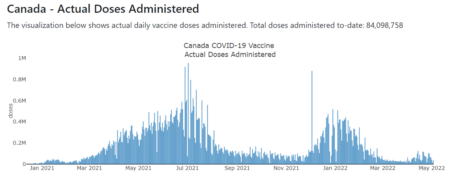
Canada COVID-19 Vaccination Schedule – Canada’s current and historical vaccine doses administered and doses distributed. Also includes two distribution forecasts: 1) based on Canadian government vaccine planning and 2) based on Sep 30 2021 goal to vaccinate all 16+ Canadians. Uses COVID-19 Canada Open Data Working Group data.
https://sitrucp.github.io/covid_canada_vaccinations
Canada COVID-19 Vaccination vs World – Canada’s current and historical ranking vs all countries in the Our World in Data coronavirus data by total doses, daily doses and total people vaccines adminstered.
https://sitrucp.github.io/covid_global_vaccinations
Global COVID-19 Vaccination Ranking – Ranking of all countries in the Our World in Data coronavirus data by daily vaccine dose administration. Includes small visualization of all time, population, vaccines used and trend. Can sort by these measures.
https://sitrucp.github.io/covid_world_vaccinations
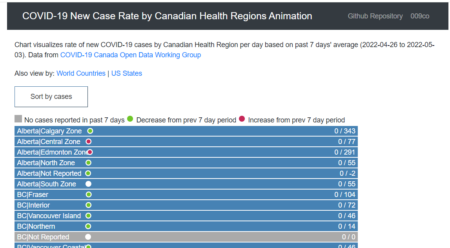
COVID-19 New Case Rate by Canadian Health Regions Animation – SVG animation of new cases visualized as daily rate for each Canadian provincial health regions. Like a horse race, faster moving dot means higher daily rate.
https://sitrucp.github.io/covid_rate_canada
COVID-19 New Case Rate by Country Animation – SVG animation of new cases visualized as daily rate for each country in the Our World in Data dataset. Like a horse race, faster moving dot means higher daily rate.
https://sitrucp.github.io/covid_rate_world
COVID-19 New Case Rate by US State Animation – SVG animation of new cases visualized as daily rate for each US state. Like a horse race, faster moving dot means higher daily rate.
https://sitrucp.github.io/covid_rate_us
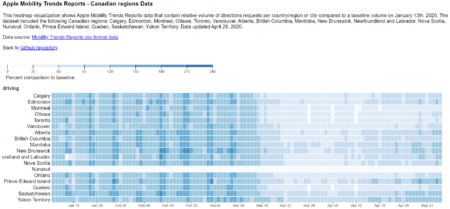
Apple Mobility Trends Reports – Canadian Regions Data – Apple cell phone mobility data tracking data used to create heat map visualizations of activity over time.
https://sitrucp.github.io/covid_canada_mobility_apple
WHO Draft landscape of COVID-19 Candidate Vaccines – AWS Textract used to extract tabular data from WHO pdf file. Python and Javascript code then used to create webpages from extracted data.
https://sitrucp.github.io/covid_who_vaccine_landscape
Montreal Confirmed COVID-19 Cases By City Neighbourhoods – Code and process used to scrape Quebec Health Montreal website to get COVID-19 case data for Montreal city boroughs.
https://github.com/sitrucp/covid_montreal_scrape_data


