The City of Toronto’s open data site includes the results of the city’s regular food and restaurant inspections. This data was as of August 2014.
The interactive chart below allows filtering by review criteria and can be zoomed into to view more detail and specific locations.
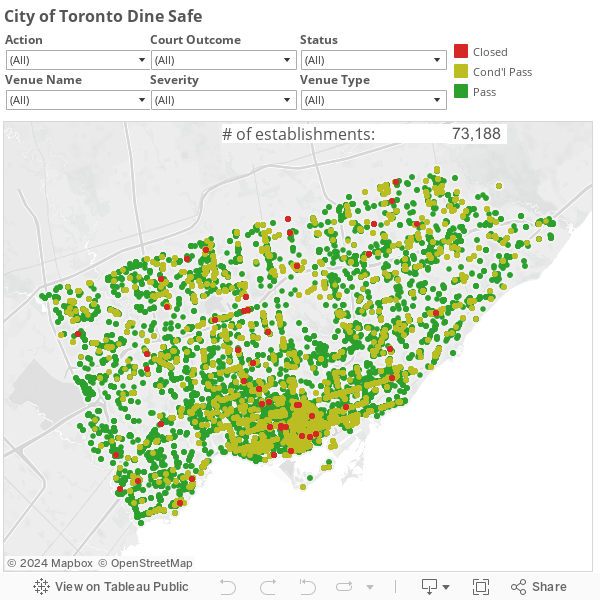
The data file for Dine Safe contained about 73,000 rows and was in XML format. In order to work with it I transformed it to csv format.
from xml.dom.minidom import parse
from csv import DictWriter

fields = [
	'row_id',
	'establishment_id',
	'inspection_id',
	'establishment_name',
	'establishmenttype',
	'establishment_address',
	'establishment_status',
	'minimum_inspections_peryear',
	'infraction_details',
	'inspection_date',
	'severity',
	'action',
	'court_outcome',
	'amount_fined'
]

doc = parse(file('dinesafe.xml'))

writer = DictWriter(file('dinesafe.csv', 'w'), fields)
writer.writeheader()

row_data = doc.getElementsByTagName('ROWDATA')[0]

for row in row_data.getElementsByTagName('ROW'):
	row_values = dict()
	for field in fields:
		text_element = row.getElementsByTagName(field.upper())[0].firstChild
		value = ''
		if text_element:
			value = text_element.wholeText.strip()
			row_values[field] = value
	writer.writerow(row_values)
This data was not geocoded so I had to do that before it could be mapped. I wanted to use a free geocoding service but they have limits on the number of records that could be geooded per day. I used MapQuest’s geocoding API using a Python library that would automate the geocoding in daily batched job so that I could maximize free daily geocoding.
The Dine Safe data file addresses needed some cleaning up so that the geocoding service could read them. For example street name variations needed to be conformed to something that MapQuest would accept. This was a manual batch find and replace effort. If I was automating this I would use a lookup table of street name variations and replace them with accepted spellling/format.
#Uses MapQuest's Nominatim mirror.

import anydbm
import urllib2
import csv
import json
import time

# set up the cache. 'c' means create if necessary
cache = anydbm.open('geocode_cache', 'c')

# Use MapQuest's open Nominatim server.
# https://developer.mapquest.com/web/products/open/nominatim
API_ENDPOINT = 'http://open.mapquestapi.com/nominatim/v1/search.php?format=json&q={}'

def geocode_location(location):
    '''
    Fetch the geodata associated with the given address and return
    the entire response object (loaded from json).
    '''
    if location not in cache:
        # construct the URL
        url = API_ENDPOINT.format(urllib2.quote(location))

        # load the content at the URL
        print 'fetching %s' % url
        result_json = urllib2.urlopen(url).read()

        # put the content into the cache
        cache[location] = result_json

        # pause to throttle requests
        time.sleep(1)

    # the response is (now) in the cache, so load it
    return json.loads(cache[location])

if __name__ == '__main__':
    # open the input and output file objects
    with open('dinesafe.csv') as infile, open('dinesafe_geocoded.csv', 'w') as outfile:

        # wrap the files with CSV reader objects.
        # the output file has two additional fields, lat and lon
        reader = csv.DictReader(infile)
        writer = csv.DictWriter(outfile, reader.fieldnames + ['lat', 'lon'])

        # write the header row to the output file
        writer.writeheader()

        # iterate over the file by record
        for record in reader:
            # construct the full address
            address = record['establishment_address']
            address += ', Toronto, ON, Canada'

            # log the address to the console
            print address

            try:
                # Nominatim returns a list of matches; take the first
                geo_data = geocode_location(address)[0]
                record['lat'] = geo_data['lat']
                record['lon'] = geo_data['lon']
            except IndexError:
                # if there are no matches, don't raise an error
                pass
            writer.writerow(record)
After the Dine Safe data was geocoded so that it had two new columns, one for latitude and another for longitude, all that was left to do was bring the data into Tableau and create the Tableau map visualization which is shown below.