Sir Patrick Stewart @SirPatStew was doing Shakespeare Sonnet readings from his home during the COVID-19 lockdown and they were really good.
I wanted to track the sonnet reading tweets’ like and retweet counts over time and show this to other @SirPatStew fans. I also thought it would be very helpful to provide an automatically updated list of links to the sonnet tweets.
So I created a daily automated job that retrieved Sir Patrick’s Twitter data, saved it in the cloud. I also created a web page that included a visualization showing the #ASonnetADay hashtag tweets like and retweet counts (screenshot below) along with a table listing the tweets in chronological order with like and retweet counts and as well as a link to the tweet.
@SirPatStew finished has long finished posting new #ASonnetADay tweets and his tweets continue to get visitors and like and retweet counts continue increasing. The automated daily job is still ongoing and the visualization continues to be updated.
View visualization: https://sitrucp.github.io/sir_pat_sonnet_a_day_tweets/
Code hosted on Github: https://github.com/sitrucp/sir_pat_sonnet_a_day_tweets
Data was retrieved from Twitter using the Twitter API and Tweepy and the visualization was created using Plotly.js dot plot and is hosted on Github.io
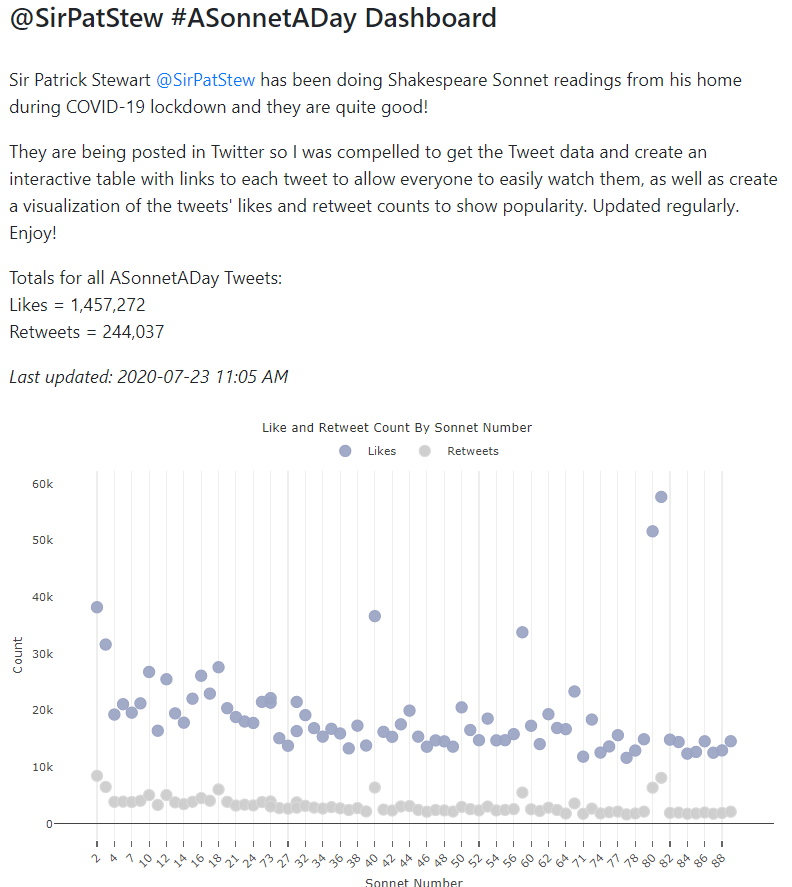
The Tweet data was used to create the following:
-
- A categorical dot plot of each sonnet’s tweet like and retweet counts.
- A tabular list of #ASonnetADay tweets with links to tweet to allow others to easily find and watch them.